
LIACS Hallmarks of Cancer Research Homepage

LIACS Hallmarks of Cancer Research Homepage
In this study, we investigate the variation between published hallmark-gene mapping schemes and the impact this has on pan-cancer research results. We reused and re-analyse data from a recent pan-cancer study, changing the hallmarks mapping scheme and keeping all other analysis components the same. The result of our investigation shows large inconsistences in the way that hallmarks are defined. This leads to differences in definition of what constitutes a hallmark gene and in what the collective set of hallmark genes can show us about similarities between cancer types
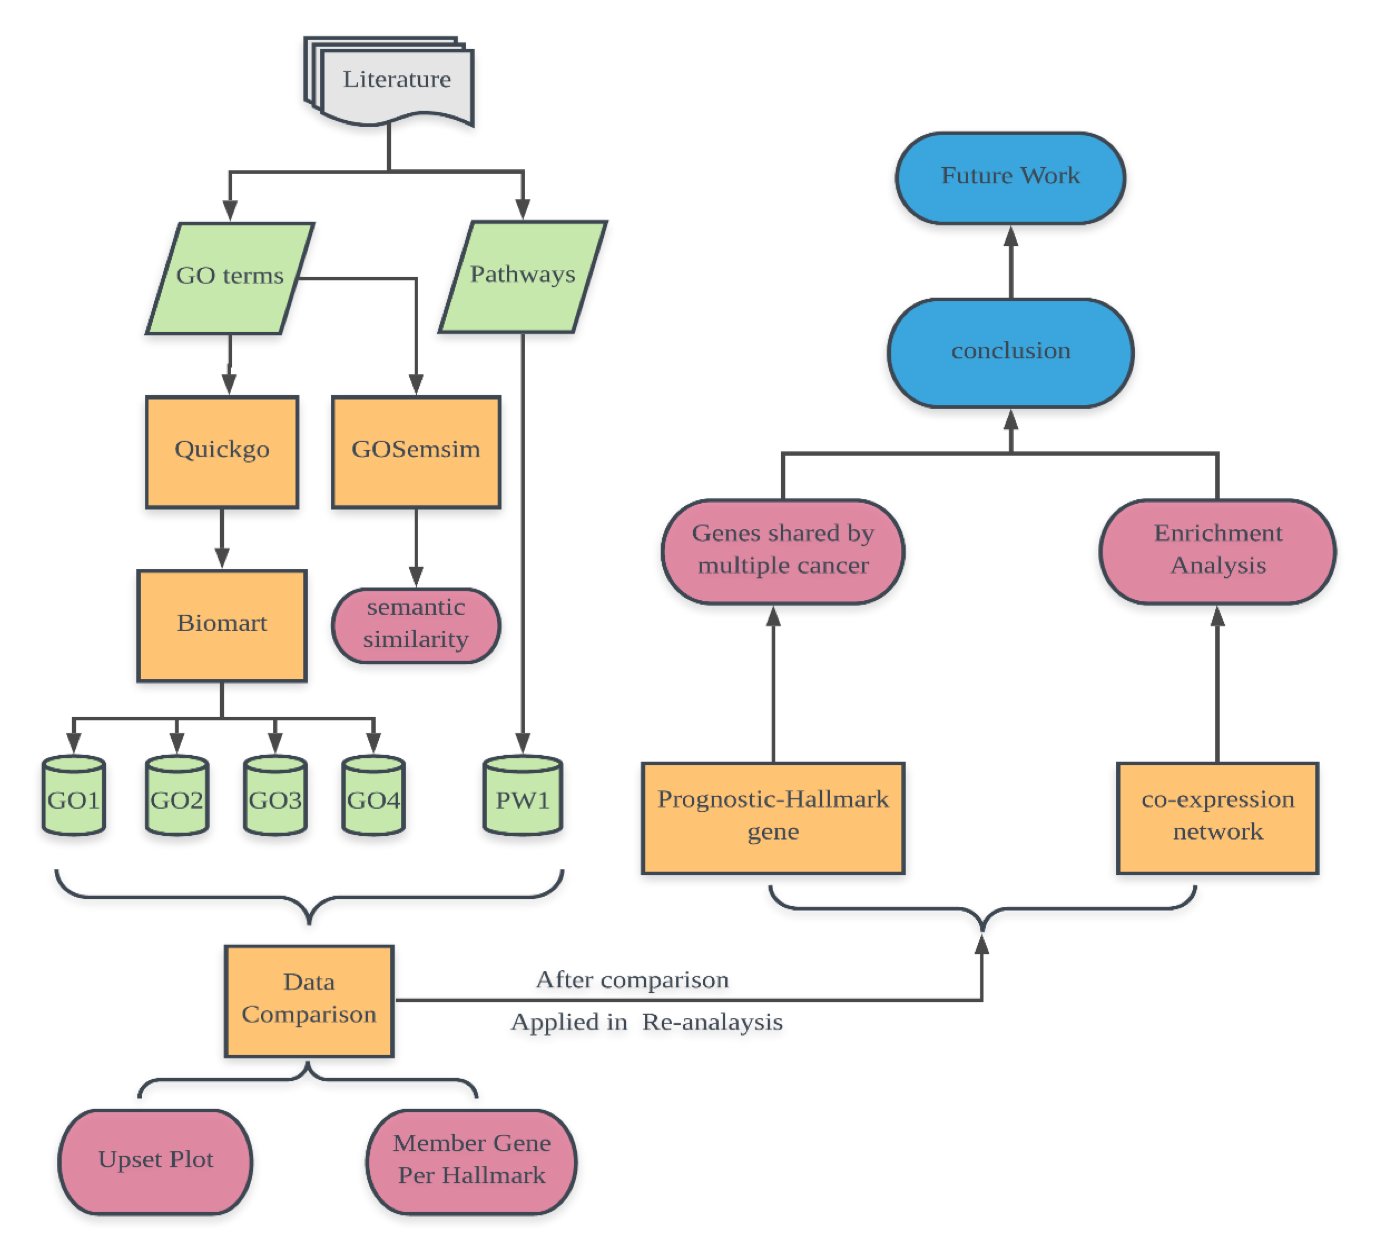
In this section, we firstly showed the conceptual workflow of our research. Then we showed the results of comparison of Gene datasets generated by using different hallmark mapping methods in different aspect.
|
|
|
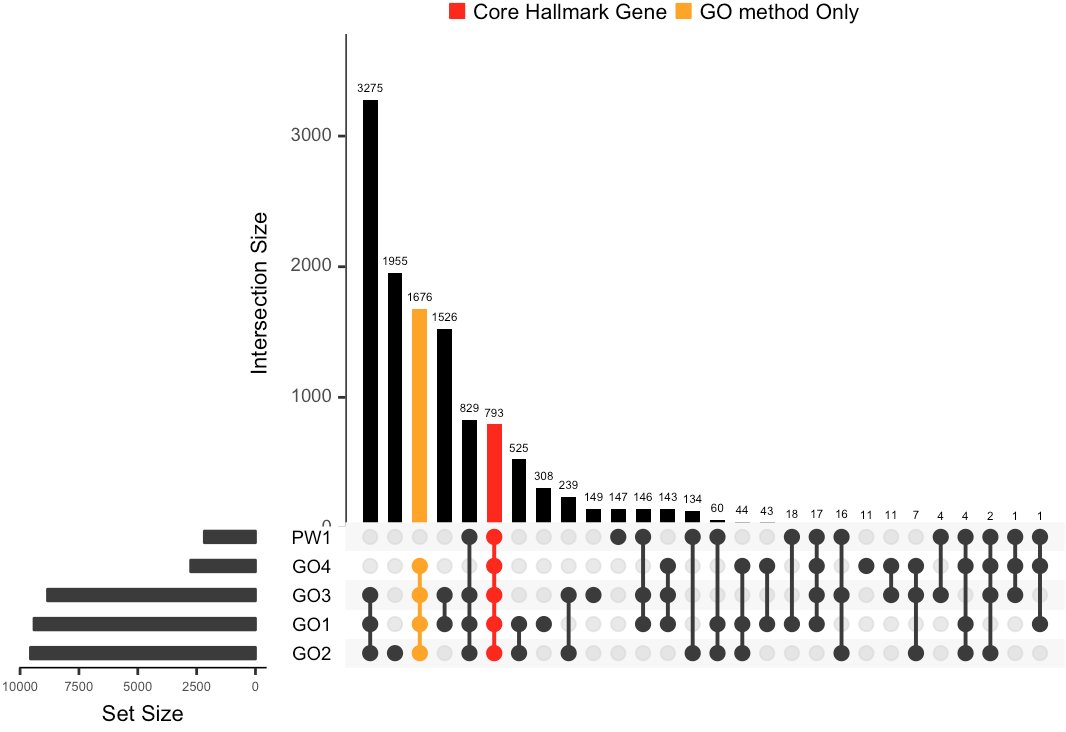
Figure 2A the upset plot presents the intersections between hallmark datasets generat-ing by different mapping methods. Bar at the upper sides represent the intersections exclusively between selected datasets.bars colored in red represent gene shared by all of the datasets while bar colored in orange represents the number of genes exclusively shared by the 4 GO mapping methods Figure 2A |
|
|
|
|
|
|
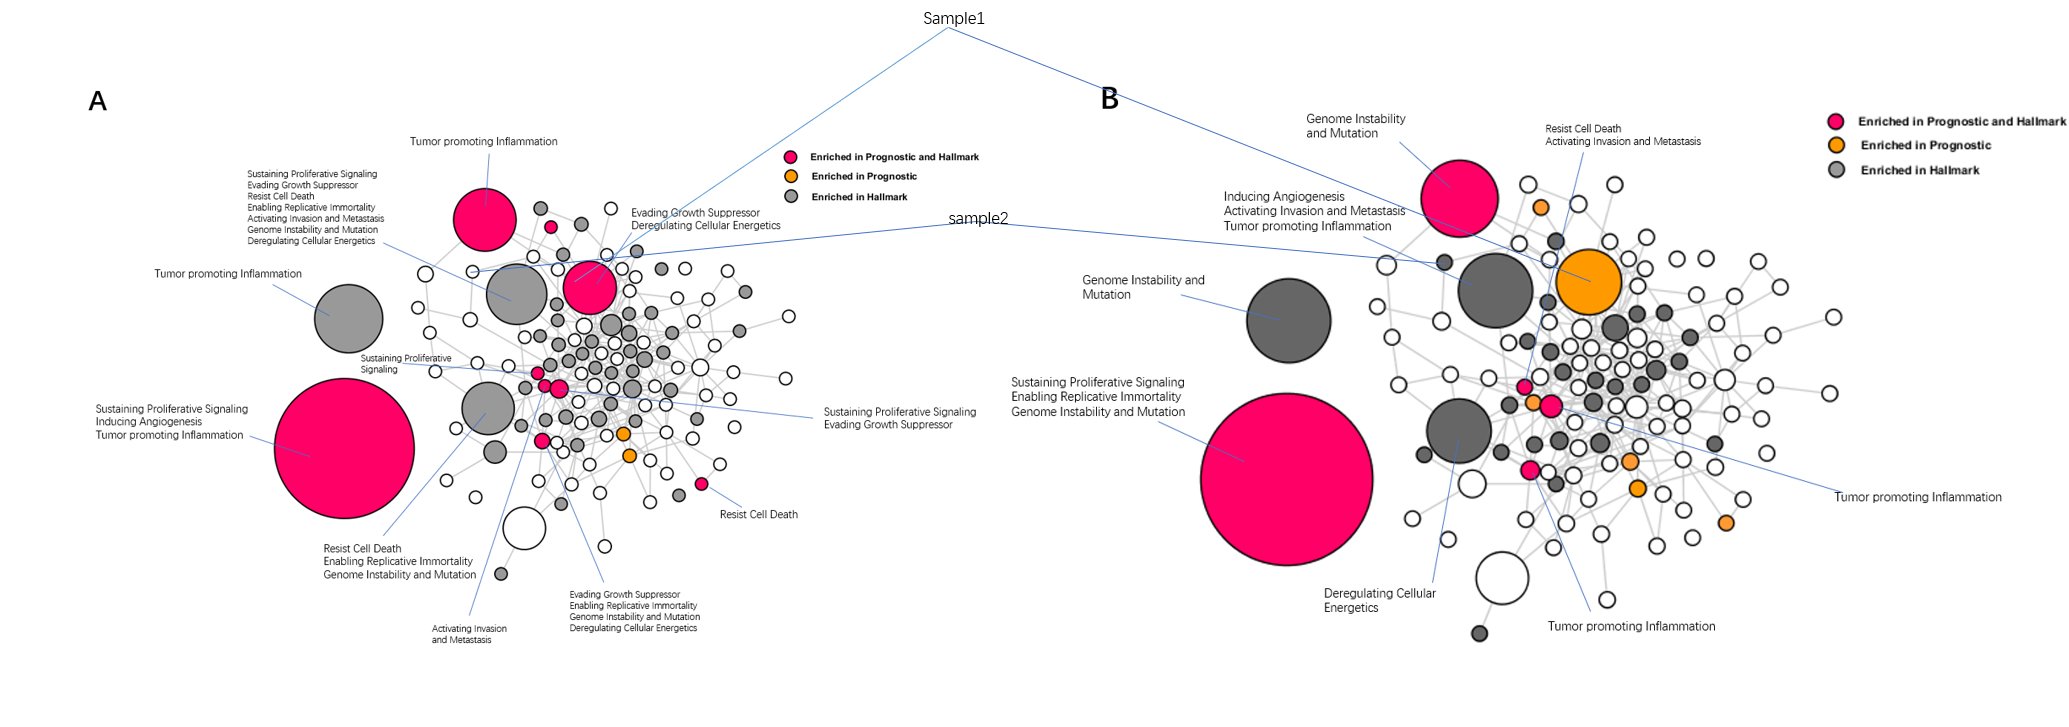
Figure 4A and 4B show cluster enrichment Analysis of Lung cancer for the GO1 and GO4 hallmark dataset. Red nodes represent enrichment in both hallmark and prognostic genes, orange represents prognostic-only enrichment and grey represents hallmark-only enrichment. The edges represent the correlations between each cluster Figure 4A&4B
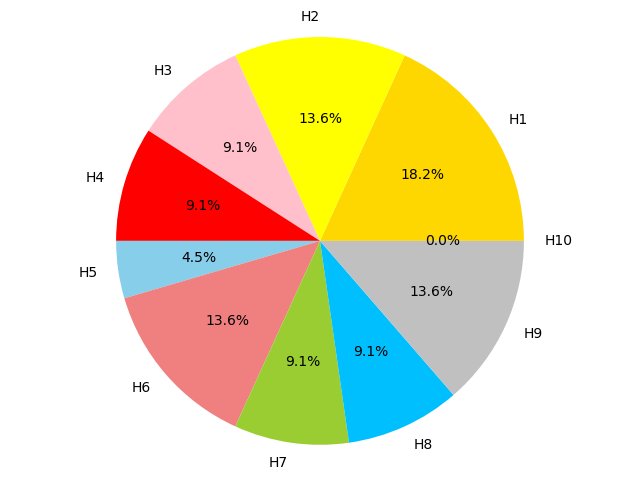
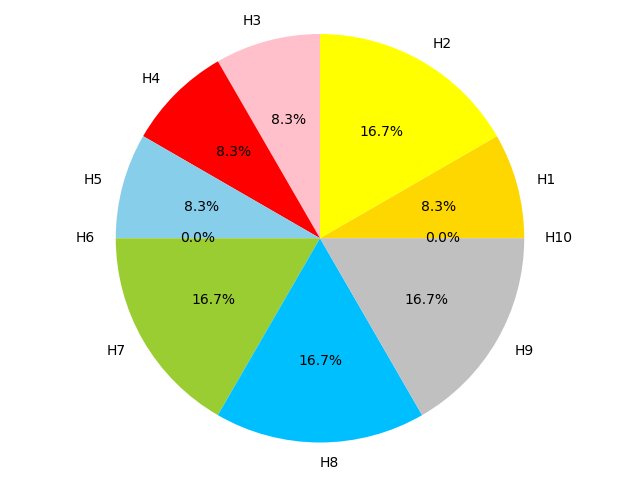
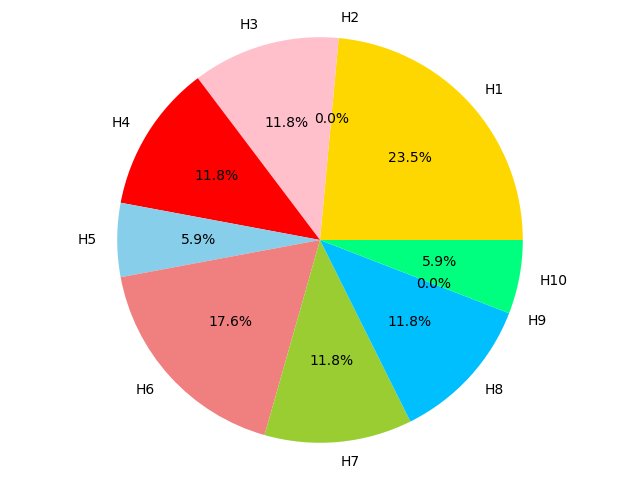
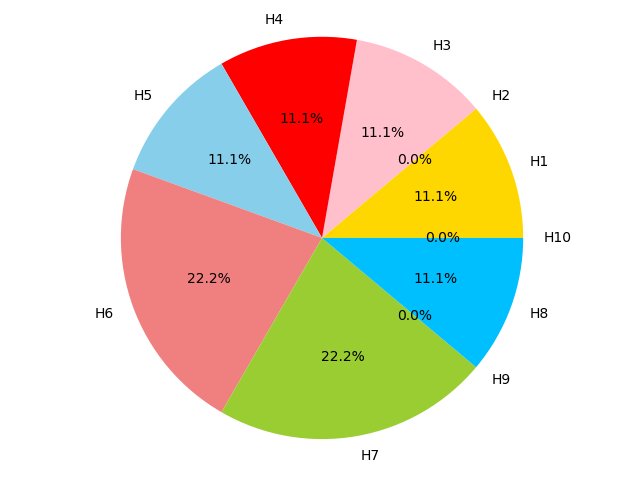
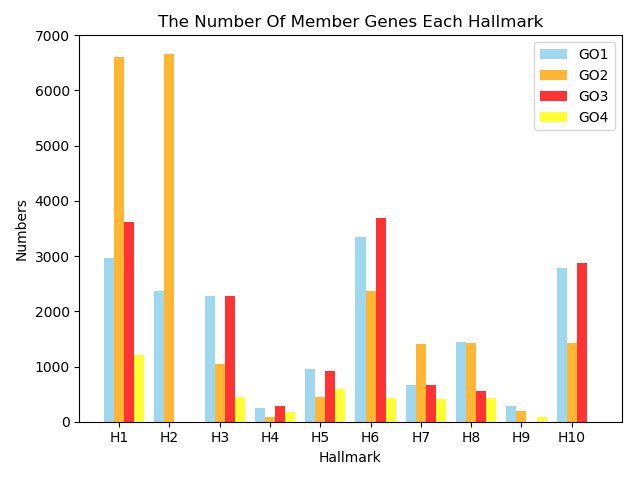
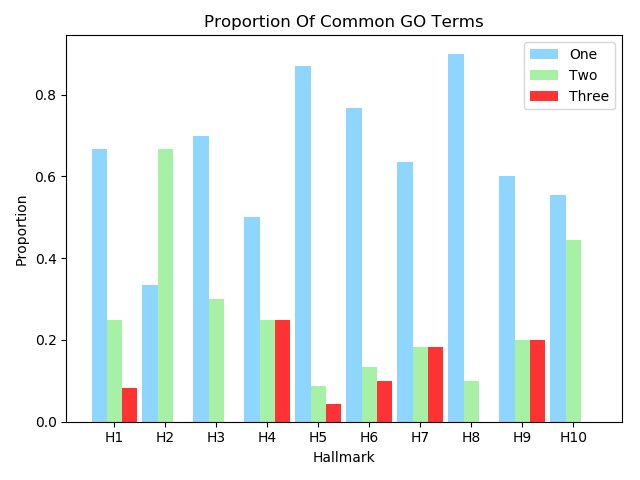
Figure 4C,4D,4E and 4F show the proportion of hallmarks that prognostic-hallmark clusters are enriched in. The corresponding hallmarks of H1 to H10 can be found in Figure 2C Figure 4C Figure 4D Figure 4E Figure 4F
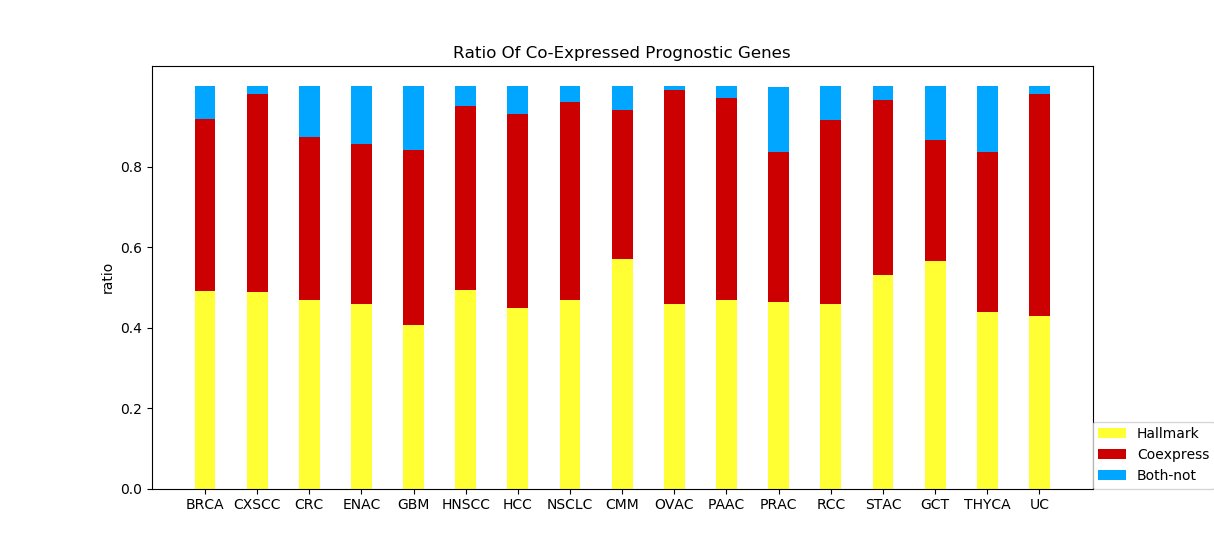
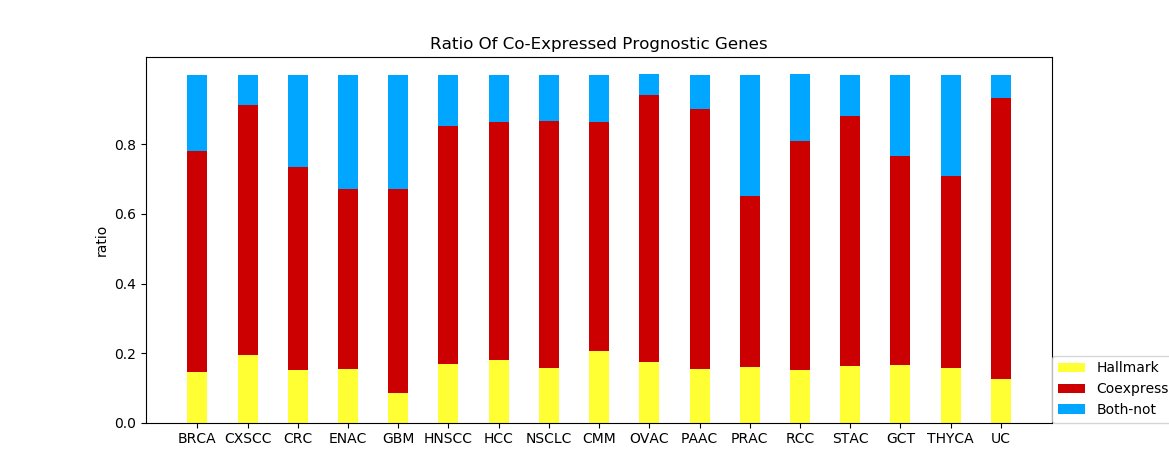
Figure 4G and 4H The two graphs show the proportion of different groups of prognostic genes when applying GO1 and GO4. Red bar represents genes co-expressed hallmark genes. Yellow bar represents prognostic-hallmark genes. Blue bar represents prognostic genes neither co-expressed with nor defined as hallmark genes marks may provide insight. Figure 4G Figure 4H
After investigating the impact on research conclusion by applying multiple mapping methods to re-analysis an study from Ulhen's research, we already noticed that due to the lack of shared-understanding on what hallmarks is,self-defined mapping methods could lead to different results. As we mentioned before, 793 genes were defined as hallmark genes in all methods.his consensus may represent a core set of genes that can be linked to cancer hallmarks with a greater confidence.
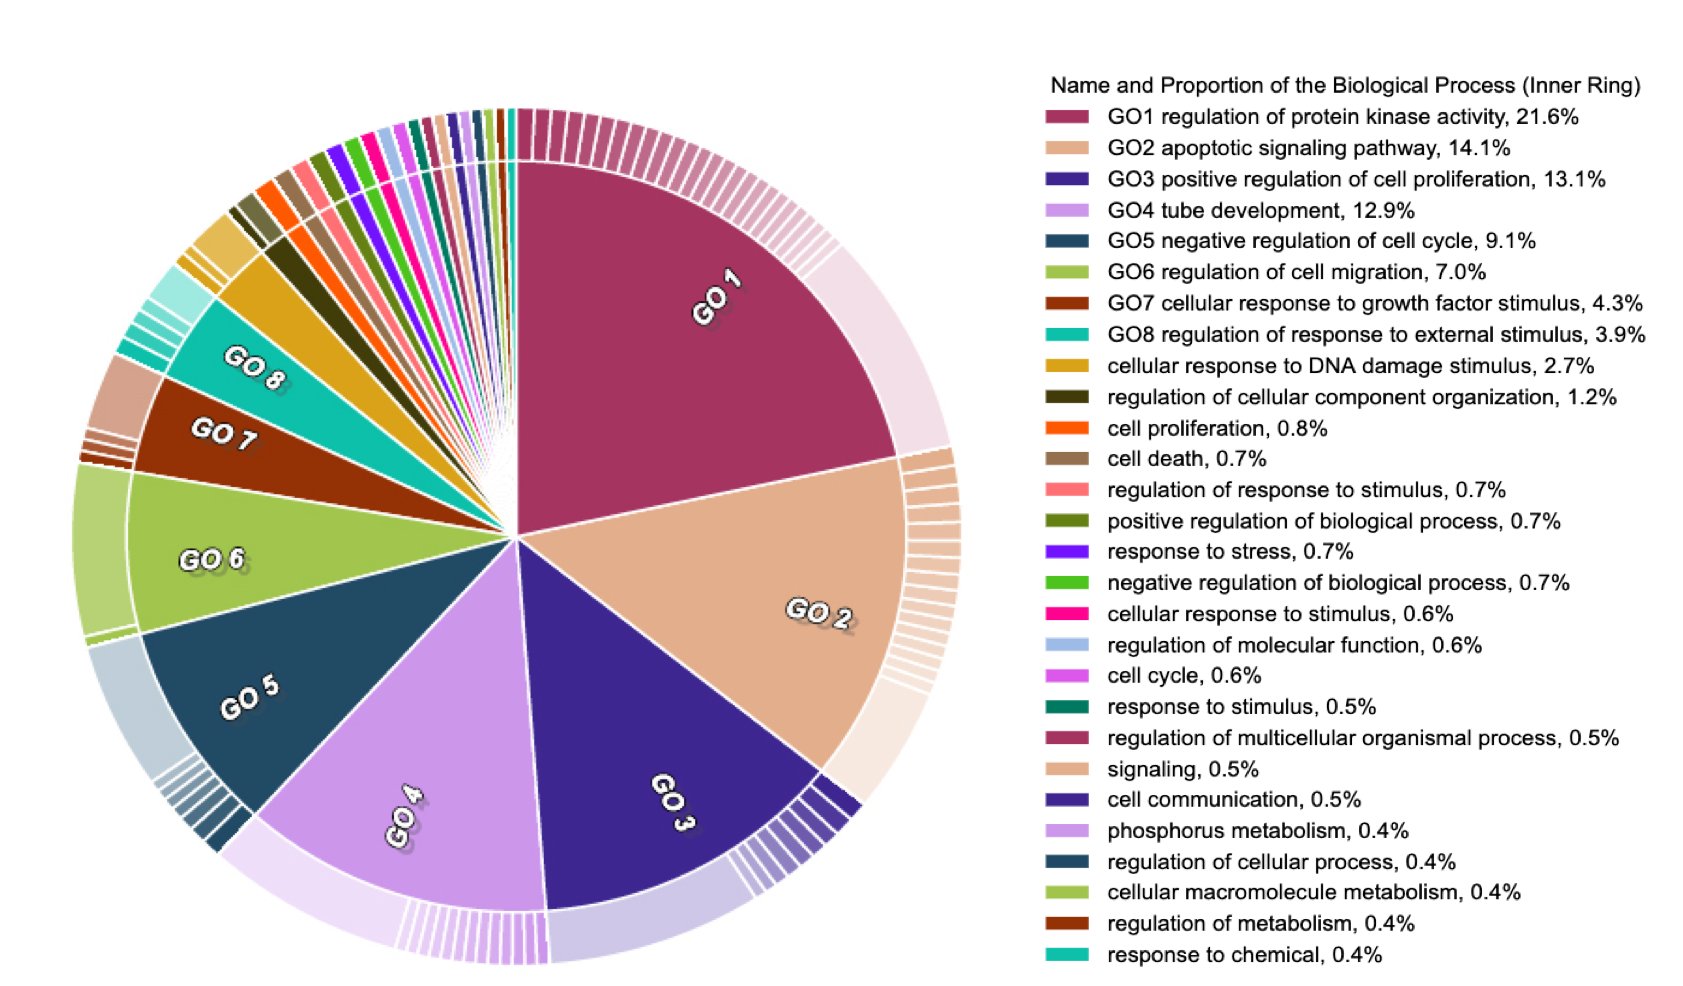
Figure 5 The enriched analysis of core gene sets. The two-layer full hierarchical struc-ture consists of an inner ring, which represents parent GO terms and the outer ring, which represents child GO termsFigure 5